Just a quick post this week, sometimes it is the simple things that are the most profound “particularly if you are not aware of them” A few months back I was chatting with a good friend and the subject rolled around to SEO the guy in question does this stuff for a living so we always get a lot of mileage out of our discussions.
At one point he asked me how I tracked stuff? “were I rank in google for certain terms” kinda caught me off guard mainly because I was not tracking anything, other than keeping a basic idea in my head. My good friend then explained how the company he worked for tracked rankings and some of the methods they used, long story short excel works fine “its more about actually keeping a record” and less about how!
As my last job in the States involved a lot of daily tracking I was quick to see that whether it be financial or anything else, like position’s in google a detailed record could be of great benefit after a certain time of laboriously collecting the data.
So I got started the next day with a few key terms concerning one of my newer sites, nearly 4 months on I’m now able to draw some info from it and am so glad I started doing this. No magic or the likes just hard cold facts that can aide me with future projects.
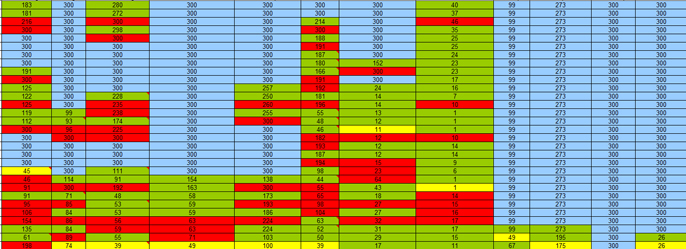
Here is a pic of the sheet I have for this one site I have been tracking.

Here are a few pointers as to what I use.
- Use a browser you never use “that would logically be Internet Explorer” as your reading this. I use fire fox cause I use chrome for 90% of stuff, and that’s were I’m logged into my google account. For tracking the stuff I use 4 colors as shown above.
- Blue indicates not in search range “top 300 for me” or was not checking.
- Green indicates better than last search or equal too last search “even if that was a red”
- Red well red is red you can probably figure that out alone
- Lastly Yellow this represents the highest place ever, and can only reside in one cell, in case of a tie most recent trumps older results.
That’s it as I hinted at in the title its pretty basic though worth the effort as it gives you a very clear view of what is going on and quite satisfying when your last line is mainly green and yellow.
Lastly here are a few other things I use but are not required, you can basically make this as complex or simple as you wish..
I use the same search settings in google all the time.
And as they are 100 per page I have a little macro in excel after copying the results which counts were I’m at on the page.
Using the same single google server “google “google server ips” or the likes”
I have no fixed schedule as to when I do the search turns out about weekly.
Total the results / places in column A this gives you an overall view along with a percentage difference in column B
Lastly I make notes with the “insert comment function” these can be abnormalities and or when you do things add pages etc.